Track your progress, take practice exams, and study the flashcards in the app.
2.5 Reading a Sectional II — Airports and Data Blocks
- Tell a towered airport from a non-towered one at a glance and name the other airport symbols
- Decode every element of an airport data block, including the CTAF, lighting and runway length
- Choose the right source — sectional or Chart Supplement — for a given piece of airport information
Airport information is the most heavily tested chart skill on the exam, and it is the one that pays off most on real jobs. A data block tells you in about fifteen characters whether there is a tower, what frequency the traffic is talking on, how high the field is and how long the runway is. Learn to read it and you will know more about an unfamiliar airport in five seconds than most people learn in five minutes.
The color rule
This one is short and it is worth full marks on its own.
Airports with Control Towers (CT) and their related data are shown in blue. All other airports and their related data are shown in magenta.
Blue airport symbol and blue text means there is a control tower. Magenta means there is not. The color applies to the symbol and to every character of the data block beneath it. If you can only remember one thing about airport symbology, remember that.
The symbol family
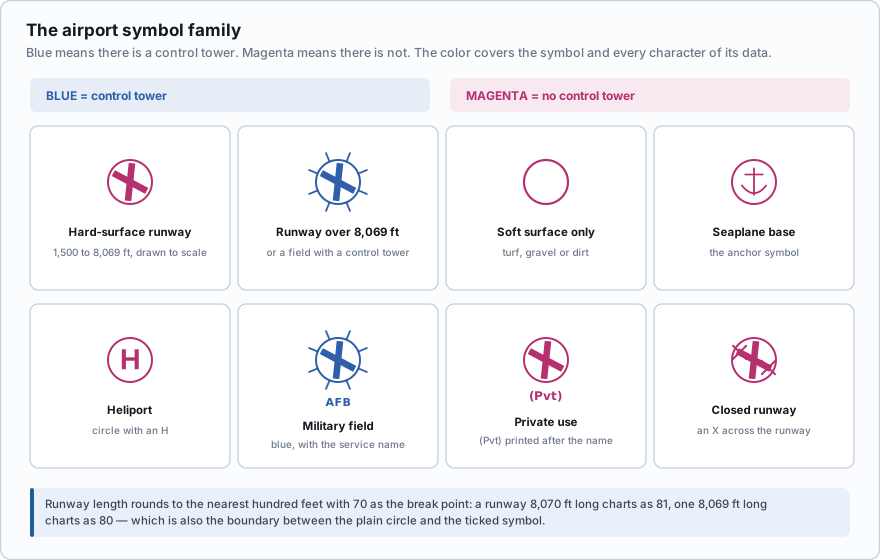
- Circle with runways drawn inside — a hard-surfaced runway 1,500 to 8,069 feet long, with the runway pattern shown to scale.
- Circle with tick marks around it — services are available: fuel, readily obtainable during normal operating hours. The ticks say nothing about runway length or about whether there is a tower.
- Runway pattern drawn instead of a plain circle — the field has a hard-surfaced runway of 8,069 feet or longer, or multiple hard-surfaced runways. That is the length cue; the ticks are not.
- Plain open circle — a field with only soft-surface runways (turf, gravel, dirt).
- Anchor symbol — a seaplane base.
- Circle with an H — a heliport.
- (Pvt) printed after the name — a private-use field. It is charted for reference, and you have no business landing there, but the airspace and the traffic are real.
- X across the runway — the runway is closed. Closed does not mean quiet; the airspace around it may still be busy.
- Military fields carry the service name and are drawn in blue, since they have towers.
A magenta airport symbol does not mean "no authorization needed." The symbol colour tells you whether the field has an operating control tower — blue yes, magenta no. It does *not* tell you the airspace. A non-towered magenta field sitting inside a dashed magenta line is in a Class E surface area, and § 107.41 authorization is required there just as it is in Class D. Check the symbol for the tower, then check the surrounding line for the airspace — they are two separate reads. (Lesson 2.4 covers the boundary lines.)
An airport symbol and all its associated text are printed in magenta. What does that tell you?
- The airport has a part-time control tower
- The airport has no control tower
- The airport is private use only
Answer: B. Magenta is the no-tower color on a sectional. Towered airports and their data are blue. Private-use fields are indicated separately by (Pvt) after the name.
The data block, element by element
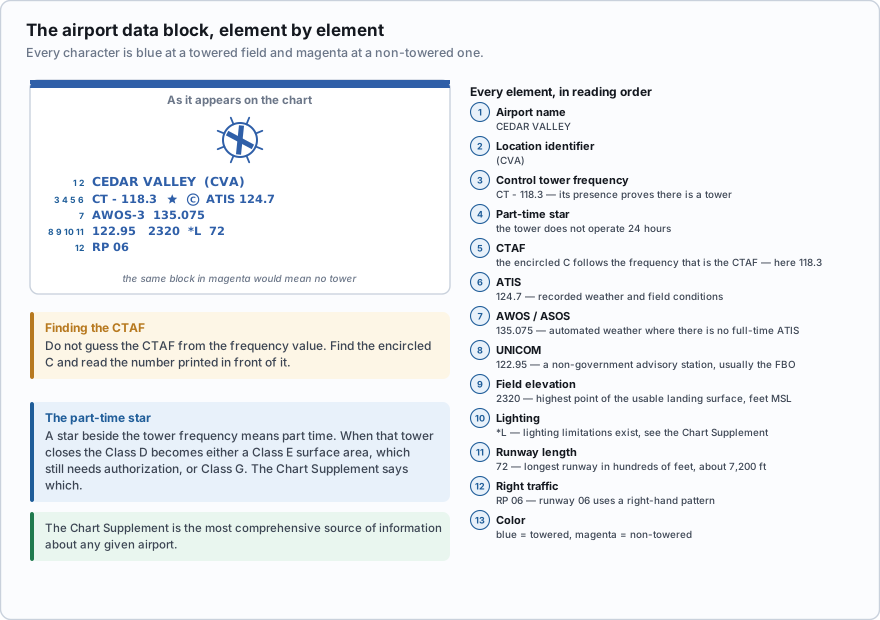
A block is read top to bottom, and not every airport has every element. Here is the full set.
| Element | Looks like | Means |
|---|---|---|
| Airport name | CEDAR VALLEY | The name, in blue or magenta |
| Location identifier | (CVA) | Three-letter or alphanumeric identifier |
| Control tower frequency | CT - 118.3 | The primary tower frequency. Its presence proves there is a tower |
| Part-time star | a solid star | The tower (or the lighting or the service it follows) operates part time. Hours are in the tower frequency tabulation and the Chart Supplement |
| ATIS | ATIS 124.7 | Automatic Terminal Information Service — a recorded loop of weather and field conditions |
| AWOS / ASOS | AWOS-3 135.075 | Automated weather observation, broadcast on that frequency. Shown when there is no full-time ATIS |
| CTAF | Ⓒ | The encircled C is placed immediately after the frequency that serves as the Common Traffic Advisory Frequency |
| UNICOM | 122.95 | A non-government advisory station, usually the FBO. At a non-towered field it is often also the CTAF |
| Field elevation | 2320 | Highest point of the usable landing surface, in feet MSL |
| Lighting | L or \*L | L = lighting operates sunset to sunrise. \*L = lighting limitations exist; see the Chart Supplement |
| Runway length | 72 | Length of the longest runway in hundreds of feet — 72 means about 7,200 feet |
| Right traffic | RP 06 | Runway 06 uses a right-hand traffic pattern instead of the standard left |
Two of those deserve extra attention because the exam leans on them.
Finding the CTAF. The Common Traffic Advisory Frequency is the frequency pilots use to announce their positions at a field with no operating tower. On the chart it is identified by the encircled C placed right after the frequency. At a towered field the Ⓒ usually follows the CT frequency, because when the tower closes that same frequency becomes the CTAF. At a non-towered field it may follow the UNICOM. Do not guess by frequency value — find the Ⓒ and read the number in front of it.
Runway length rounding. Length is given in hundreds of feet, rounded to the nearest 100 with 70 as the rounding point. A runway 8,070 feet long charts as 81; a runway 8,069 feet long charts as 80. The chart also warns that usable length may be less than the physical length.
Part-time towers deserve one more paragraph, because they change the airspace under your feet. When a part-time tower closes for the night, the Class D does not stay Class D. Depending on what the FAA designated for that field, it becomes either a Class E surface area — still requiring authorization under §107.41 — or Class G, requiring nothing. The chart cannot show you which, because the chart shows the daytime picture. The Chart Supplement entry and the tower frequency tabulation give the hours and the reversion. If you plan an evening shoot near a starred tower, look it up rather than assuming.
Used well, one data block answers most of your planning questions before you leave the office: the color tells you whether authorization is likely, the field elevation converts every charted MSL altitude into a real height above your site, the CTAF gives you a receiver frequency, and the RP note tells you which side of the runway to stay away from.
`
CEDAR VALLEY (CVA)
CT - 118.3 (star) Ⓒ ATIS 124.7
122.95 2320 *L 72
RP 06
`
Reading it in order: Cedar Valley, identifier CVA. There is a control tower on 118.3, and the star tells you it is part time. The Ⓒ follows 118.3, so 118.3 is also the CTAF when the tower is closed. ATIS is on 124.7. UNICOM is 122.95. The field elevation is 2,320 feet MSL. \*L means the runway lights have limitations and you should read the Chart Supplement entry. The longest runway is about 7,200 feet. Runway 06 uses right traffic.
For a drone job on the edge of this field, that block tells you the pattern side to avoid, the frequency to monitor, and — through the field elevation — how to convert the airspace ceiling into a height above your own ground.
A sectional data block for a non-towered field lists 122.7, 122.8 and 135.075. The encircled C is printed immediately after 122.8. Which is the CTAF?
- 122.7
- 122.8
- 135.075
Answer: B. The encircled C marks the CTAF, and it is printed immediately after whichever frequency serves that role. Do not grab the first frequency in the box — on the FAA's published Coeur d'Alene sample question the first frequency listed is the one that is wrong.
The Chart Supplement
A sectional gives you the airport at a glance. The Chart Supplement U.S. — the book pilots still sometimes call the Airport/Facility Directory — gives you everything else. It is published in regional volumes on a 56-day cycle and is free on the FAA website.
It carries the full runway dimensions and surface, taxiway layout, all communications frequencies with their hours, the airspace notes, obstructions on the approach paths, fuel and services, noise abatement procedures, tower and weather service hours, and remarks specific to that field. When a question asks which source gives the most comprehensive information about a given airport, the answer is the Chart Supplement. That is a published FAA sample question and it comes up often.
- Blue = towered. Magenta = non-towered. The color covers the symbol and all its text.
- CT- followed by a frequency proves there is a control tower; a star means it is part time.
- The encircled C is printed immediately after the frequency that is the CTAF.
- Field elevation is the highest point of the usable landing surface, in feet MSL.
- L = lighting sunset to sunrise; \*L = lighting limitations, see the Chart Supplement.
- Runway length is in hundreds of feet, rounded with 70 as the break point. RP = right traffic pattern.
- The Chart Supplement is the most comprehensive source of airport information.
The segmented circle — the ring of white panels around a wind indicator that shows traffic pattern direction — is a ground installation you see at the airport, not a sectional chart symbol. If a question offers it as the way a chart shows right traffic, that is wrong: the chart shows right traffic as RP followed by the runway number.
Field elevation matters more to a drone pilot than to most airplane pilots, because it is the number that converts a charted MSL airspace floor into a real height above your launch point. Pull it off the chart during planning and write it on your crew card. When you are standing at a job site arguing about whether the shelf overhead is 900 or 1,900 feet above you, that one number settles it.
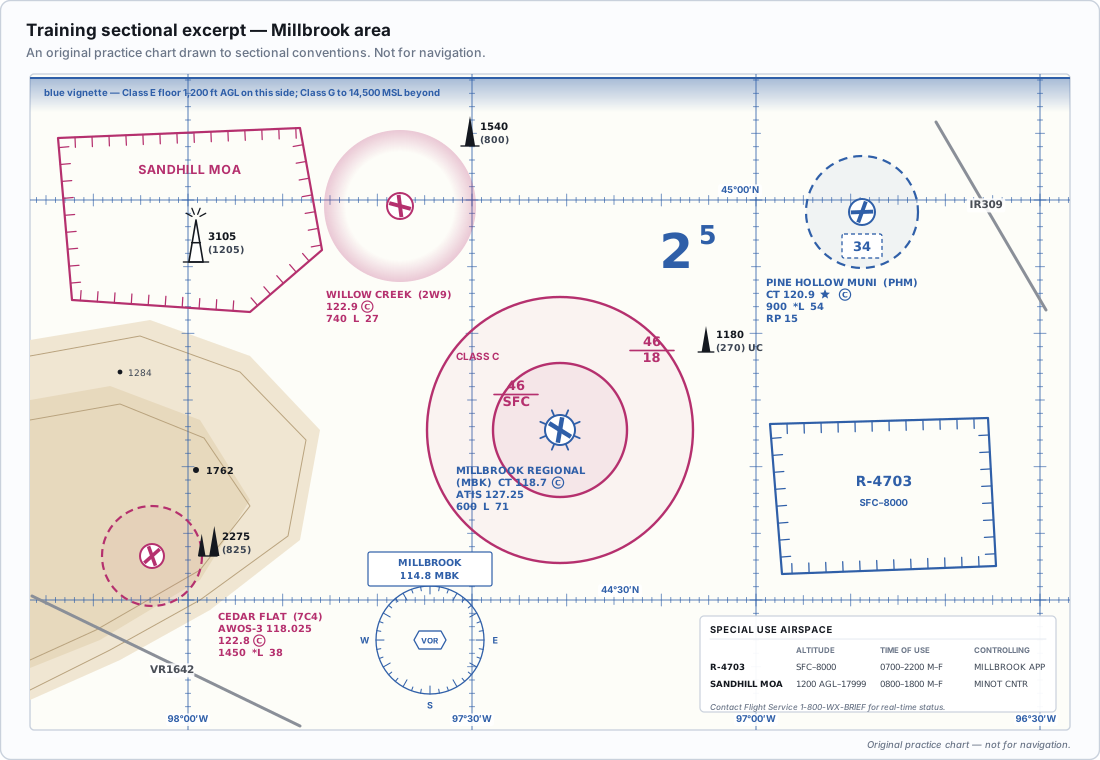
- Blue airport symbols and text mean a control tower; magenta means no tower
- CT- gives the tower frequency and a star means the tower operates part time
- The encircled C is printed immediately after whichever frequency serves as the CTAF
- Field elevation is in feet MSL and runway length is in hundreds of feet
- L means lighting sunset to sunrise; *L means lighting limitations exist, see the Chart Supplement
- RP followed by a runway number means that runway uses a right-hand traffic pattern
- The Chart Supplement is the most comprehensive source of information about a given airport